One a day I got to know a gay who created a polygon diagram and use that as a filter. I was very impressed of that and wanted really to rebuild that one.
See my workbook here
So how to do that?
- First of all I cheesed a picture. I decided to take a shop square plan. Click right to the picture you cheesed and go to "Features" - "Details"
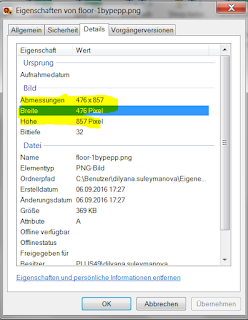
- Remember wider and higher
- In order to open this picture with tableau, I created a Google sheet with this two coordinates:

In order to open this file with tableau you should go to:
- Maps
- Background Image
- Import
- And fill details as on the example below

- Press "OK"
- Drop the X axis to column and the Y axis to the rows - and you will get this picture

- Now I want to show some departments on this picture, like where customers can find some kitchen equipments, books, games etc. In order to highlight the area, you have to mark some points on it
- Choose any point on the picture and click right
- Add a note
- Point
- X, Y coordinates will appear on the picture. Put this coordinate in to the Google sheet.
I highlighted some areas and created follow data set:

In the first column you see different department. In order tableau diversify 4 points per section I added the second column where I separated this points using a trick. I classified one department in to a,b,c and d. With this data set you will be able to create a polygon diagram.
How to create a polygon diagram?
- Drop the "Store department" to the color
- Drop the "Interlingua" (second column) to the details and you will get this graph:

- Put "Store department" to the filter or just use the whole sheet as a filter. It is all up to you now.
Statement
With this graph I had some difficult. First of all it was hard-going to create separate departments because as soon as I marked some points I get a square sign of eternity. I could understand why?.
Another challenge was to place the points exact to the area I want to highlight. You can see e.g by books or music department. I was unable to create the biggest department on the bottom part of the graph. Even if I mark more than 4 points per department. But I work on this problem. And will share the solution as soon as I get some answers.
If you have some questions left, don't hesitate to ask me.
Wow great google sheet add on, this tool will help me alot to generate reports. My Clients will be happy with my this effort. Thank you so much
AntwortenLöschenGreat Article. your writing style is too good, its is very very helpful for all of us and I never get bored while reading your article because, they are becomes a more and more interesting from the starting lines until the end.
AntwortenLöschenTableau online training
Thank you so much for sharing this worth able content with us. The concept taken here will be useful for my future programs and i will surely implement them in my study. Keep blogging article like this.
AntwortenLöschenTableau Online Training|
SAS Online Training |
R Programming Online Training|